A comparative analysis of Two South Indian States
By Philip Mudartha
Bellevision Media Network
12 Aug 2022:
Synopsis:
“Many state borrow and spend on unproductive projects which will send them into debt trap. Many politicians’ aim is to spend more in order to get more kick-backs or spend on popular dole out to get more votes. At least, Kerala is in trap; to give salary of government employees borrowing is required” so commented A T Mathai in response to my article ‘India’s debt: Signs of alarm bells’ published by this website on 25th July 2022.
Does Kerala borrow to pay salaries of government employees? I decided to explore the ground realities of fiscal management in Kerala and in its neighboring and our home state Karnataka. I based my research on the publicly available budget documents of both states for FY2022-23.
Before I summarize my findings, let me go through some figures for these states.
• Population: 2021 Estimates are about 7.0 crores and 3.5 crores for Karnataka and Kerala respectively. Roughly put, there are two Kannadiga for every Keralite.
• Human Development Index (HDI): Kerala has better HDI which means that Keralites have longer lifespan, their education level is higher, and the gross state domestic product (GSDP) per capita is higher. HDI for Karnataka is 0.682 and for Kerala is 0.784 based on published data for 2018. Based on social indicators, Kerala is more advanced than Karnataka.
• Literacy Rate 2011 Census: 93.91% in Kerala compared to 75.60% in Karnataka with national average at 74.04%. According to the National Family Health Survey (NFHS-5), Kerala tops the list in literacy rates among Indian states with 96.2% while the rate in Karnataka is 77.2% (National rate is 77.7%). The gender gap in literacy (difference between male and female literacy rates) in Kerala is only 2.2% while it is 12.9% in Karnataka. Kerala is progressive in women empowerment compared to Karnataka.
• Unemployment Rate: According to Economic Survey 2021-22, the average for FY2018-19, FY2019-20 and FY2020-21 is 5.8% in Karnataka and 15.4% in Kerala (National average is 10.6%). Kerala tops among all states in Unemployment.
• Poverty Ratio: According to Economic Survey 2021-22, the Poverty Headcount ratio (HCR) by Census 2011 for Karnataka is 20.91% and for Kerala 7.05% (National average is 21.92%).
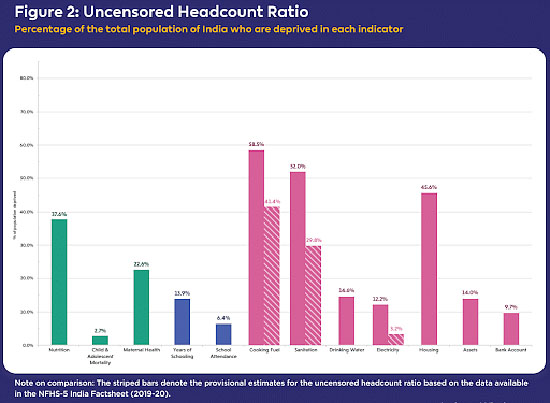
• Multidimensional Poverty Index (MPI): NITI Aayog undertook our first MPI survey based on global indicators of development and released its findings in March 2021. The headcount ratio for Kerala was 0.71%, the lowest among States in India (national average 25.01%) while it was 13.16% for Karnataka.
• Kerala is more successful in poverty reduction and bridge income inequality.
Now, summery of my findings as below:
Committed expenditure of a state typically includes expenditure on payment of salaries, pensions, and interest. During FY2022-23, the committed expenditures of Kerala and Karnataka are 71% and 50% respectively of their net receipts.
Compared to Kerala, Karnataka funds capital outlay better. Capital outlay comprises expenditure for development schemes by creation of assets including on building schools, hospitals, and roads and bridges. The capital outlay of Kerala and Karnataka are Rs 14,891 crore (9%) and Rs 43,573 crore (30%) respectively of their net receipts. However, in both states the capital outlay is financed through net borrowings and not through revenues.
During FY2022-23, the debt repayment by Kerala and Karnataka account for 24.1% and 5.3% respectively of their total expenditure. During FY2022-23, the net borrowing of Karnataka is Rs 57,821 crores compared to Rs 27,856 crores for Kerala. Net debt is amount is difference between new borrowing and debt repaid during the FY2022-23. Karnataka has greater ability to borrow and spend on development schemes because it is lesser indebted than Kerala. Kerala has almost exhausted the option to borrow more to spend on development schemes.
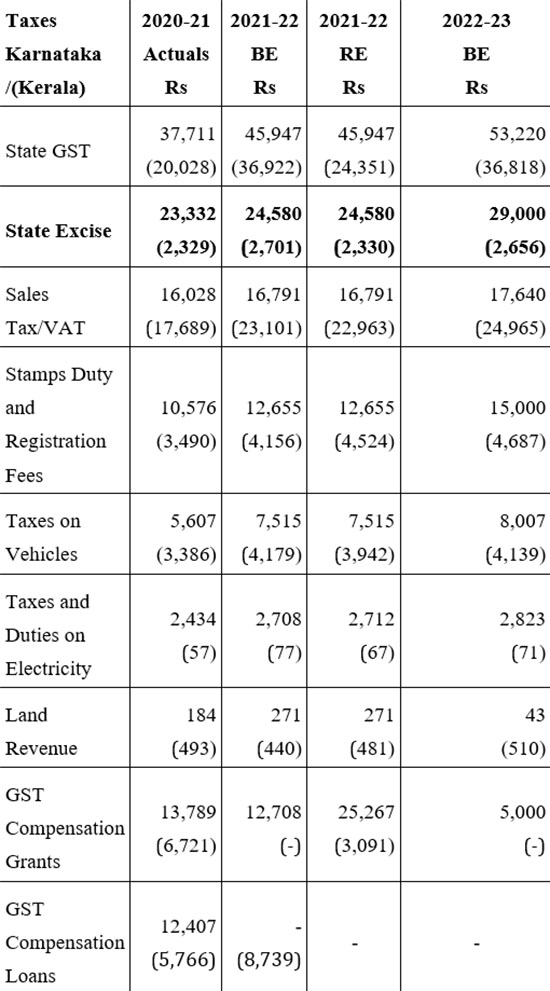
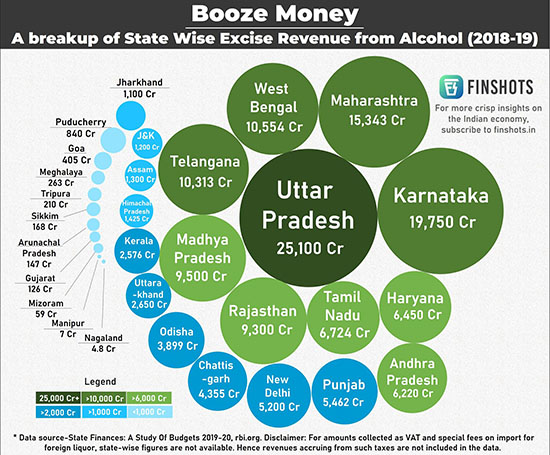
The states own tax revenue share to total revenue is 55% for Kerala and 67% for Karnataka. Karnataka collects more taxes from its residents than Kerala does. Especially, the noted difference is the taxes collected through state excise: 3.6% and 22.9% in Kerala and Karnataka respectively of total state tax revenues for FY2022-23. Kerala could revise its liquor policy and collect additional revenue through state excise.
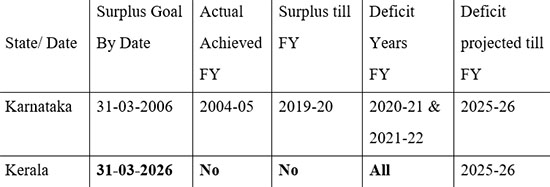
Karnataka had achieved positive revenue balance in FY2004-05 and had sustained it till FY2019-20. It is only due to Covid-19 pandemic, it became a revenue deficit state. In comparison, Kerala had always spent more than it earns and therefore, it continues to be a revenue deficit state since decades. (Revenue Balance is the difference of revenue expenditure and revenue receipts).
Data Tables and explanatory notes:
Economy: Both Kerala and Karnataka have comparable economies with services sector contributing two-third of Gross State Domestic Product (GSDP).
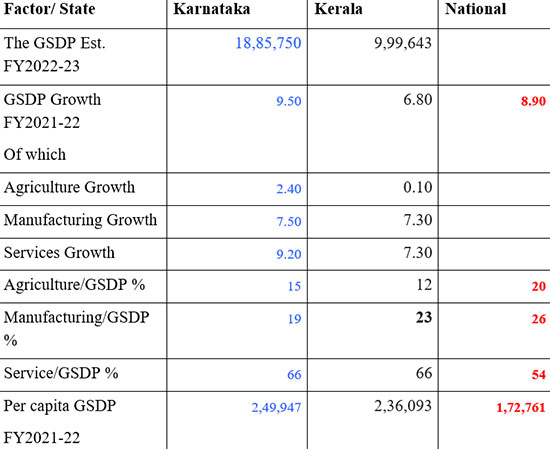
Table 1: Budget 2022-23 - Key figures (in Rs crore): The figures for Kerala are within the brackets below the figures for Karnataka.
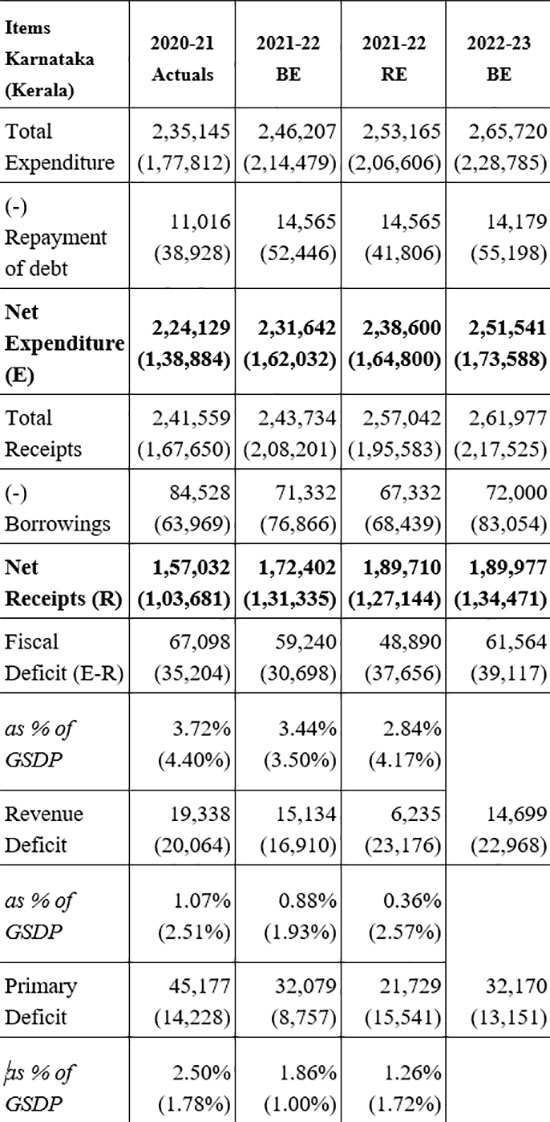
Table 2: Expenditure budget 2022-23 (in Rs crore): The figures for Kerala are within the brackets below the figures for Karnataka.
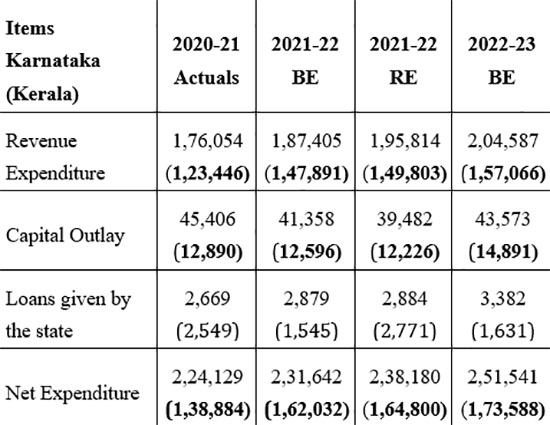
Table 3: Committed Expenditure in 2022-23 (in Rs crore):
Committed expenditure of a state typically includes expenditure on payment of salaries, pensions, and interest. Allocation of a large portion of the budget for committed expenditure items limits the state’s flexibility to decide on other expenditure priorities such as developmental schemes and capital outlay.
The figures for Kerala are within the brackets below the figures for Karnataka. The size of economy of Kerala is half that of Karnataka and yet, the expenditures on salaries (31.2% of net revenue) and pensions (20% of net revenue) paid to its government servants are higher.
Total committed expenditure of Kerala is 71% of total revenue receipts, only Himachal Pradesh spends more.
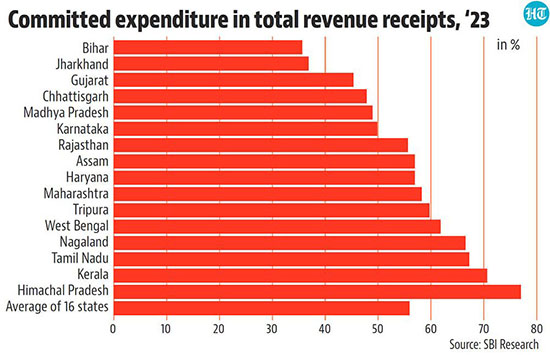
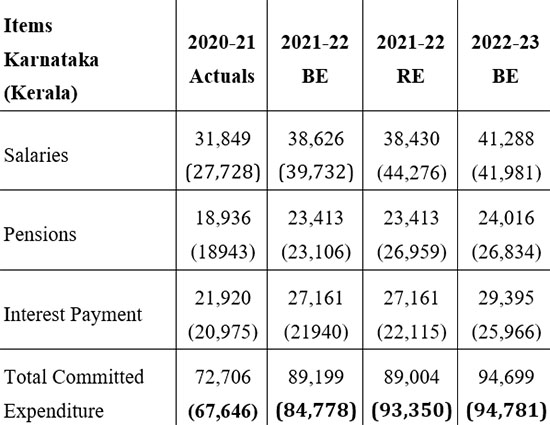
Table 4: Sector-wise expenditure (in Rs crore): The figures for Kerala are within the brackets below the figures for Karnataka.
The allocation to Education Sector is 1.7% and 2.5% of GSDP in Karnataka and Kerala respectively during FY2022-23, much lower than the 6% goal set by National Education Policy (NEP-2020).
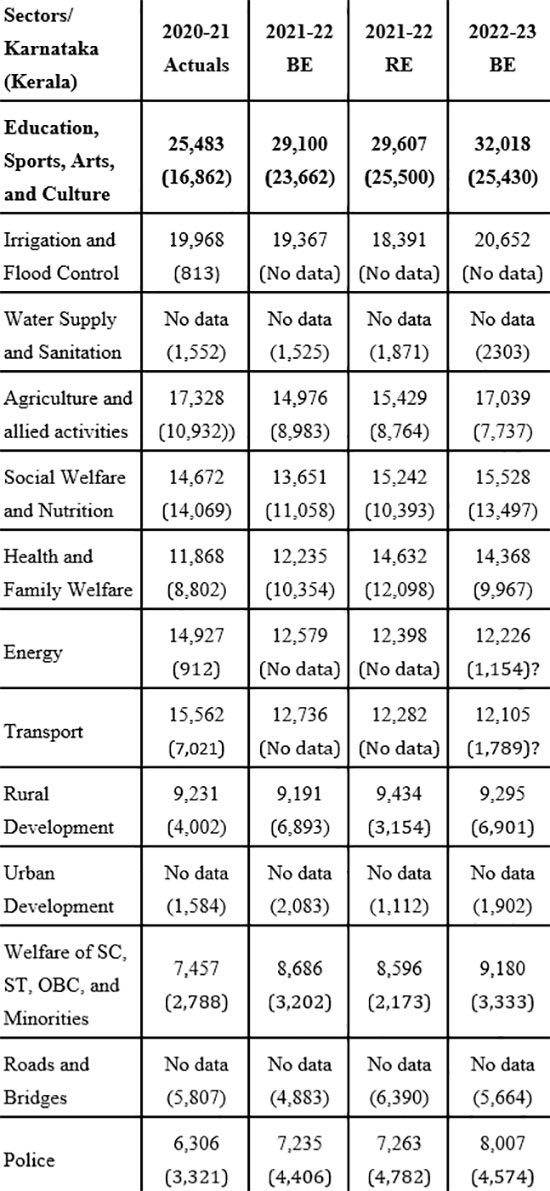
Table 5: Break-up of the state government’s receipts (in Rs crore): The figures for Kerala are within the brackets below the figures for Karnataka.
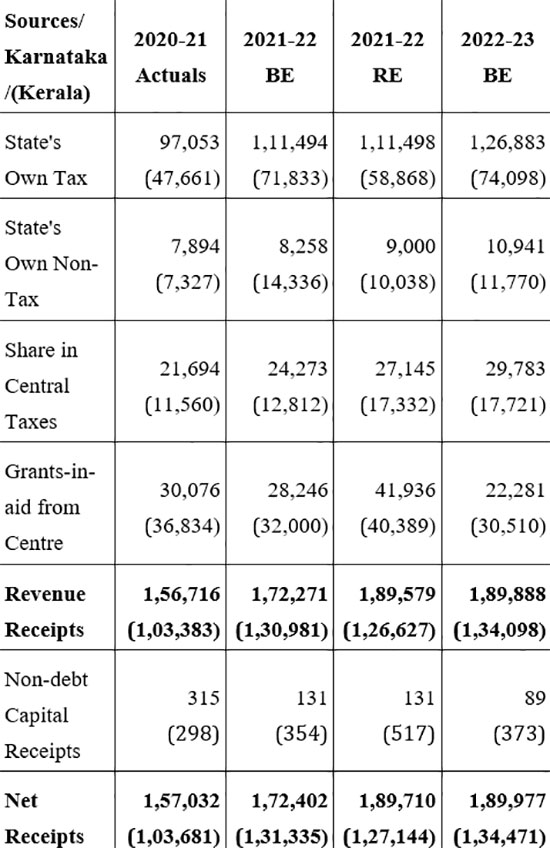
Table 6: Major sources of state’s own-tax revenue (in Rs crore): The figures for Kerala are within the brackets below the figures for Karnataka.
Kerala has opportunity to revise its liquor policy and raise revenue as its neighbor Karnataka is doing.
Revenue Deficit: Karnataka with its low revenue deficit could soon turn a revenue surplus state which it was since FY2004-05 until Covid-19 pandemic disrupted its economy.

Revenue Balance:
It is the difference of revenue expenditure and revenue receipts. A revenue deficit implies that the government needs to borrow to finance its expenses which do not increase its assets or reduces its liabilities.
Fiscal deficit (FY2022-23 Estimate):

Outstanding liabilities:
Outstanding liabilities is the accumulated debt at the end of a financial year, it also includes any liabilities on public account.

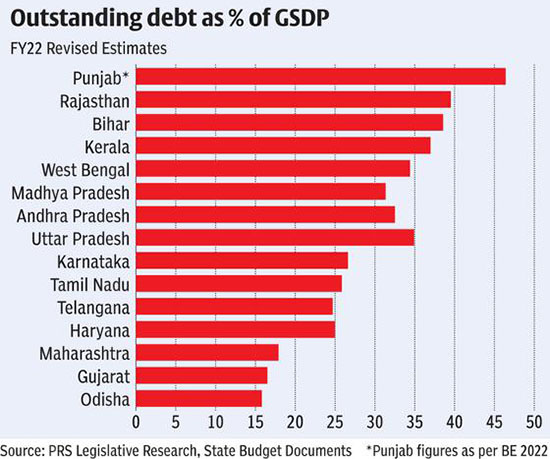
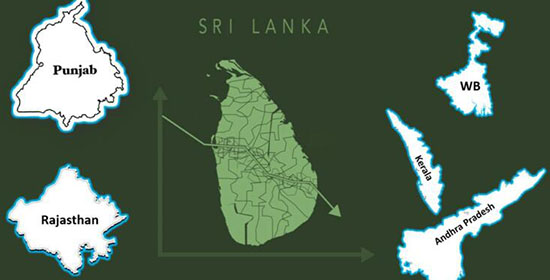
Kerala is in league of the higher indebted states like Punjab, West Bengal, Rajasthan and Andhra Pradesh which are mini-Sri Lanka in the making.
Outstanding Government Guarantees:
State governments guarantee the borrowings of State Public Sector Enterprises (SPSEs) from financial institutions.

Subsidies:
During FY2022-23, subsidies bill of Karnataka is estimated at Rs 26,114 crores. Of which, the energy sector’s share is Rs 12,000 crores, the agriculture and horticulture sector, food and civil supplies sector and commerce and industries sector receiving the balance.
Similar data for Kerala is not available. The budget speech mentions a subsidy of Rs 500 crores for Rubber, Rs 1,000 crores for new solar panel installations and Rs 2,000 to tackle price rice in order to ensure food security. Being a socialist welfare state led by left parties (CPM), Kerala probably spends more on subsidies but includes it as revenue expenditure.
Currently, there is a national debate on “freebies” after PM Modi labelled them as “revdis” distributed to win votes. The subject requires an exclusive analysis with the pros and cons of subsidies.
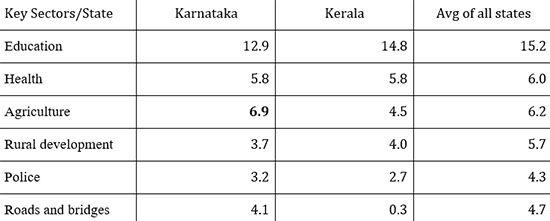
Comparison of states’ expenditure on key sectors: Only Karnataka spends more on agriculture than the national average.
Concluding Remarks:
First, on Kerala Model:
The voters in Kerala have always voted out the incumbent governments, with the Congress-led United Democratic Front (UDF) and the CPM-led Left Democratic Front (LDF) ruling the state alternately for the full term of five years. However, in the assembly elections held in May 2021, the incumbent LDF government was re-elected for another five-year term, a record in 44 years. The LDF claimed that the verdict is people’s re-affirmation of its economic policies and their stamp of approval to continue them.
Kerala has a robust public distribution system (PDS). Rice, wheat, sugar and kerosene are distributed to ration card holders at subsidized prices in order to ensure food security.
Kerala’s unemployment problem was compounded when more than 17 lakh Non-Resident Keralites (NRK) returned to the State in the wake of Covid-19. Majority of them were low-skilled workers in the Gulf countries who lost their jobs. Rehabilitation and reintegration of NRKs is a big challenge.
Kerala is a high wage state. In 2020-21, the average daily wage rate of male unskilled workers in the agricultural sector was Rs 742 and of female workers was Rs 537. Cash crops and plantation crops which require less labor are mainstay of agriculture. Domestic production of meat, eggs and milk falls short of consumption and the short-fall is met by imports from neighboring states.
Kerala has high road density unlike the rest of India. However, the number of vehicles per 1,000 populations as on March, 2021 is 445. (India18, China 47, USA 507). This means that Kerala’s vehicle population is at par with developed countries. Consequently, Kerala has high road accident rate; 2979 deaths and 30,510 serious injuries were reported according to last available data.
Secondly, on Karnataka roadmap for future:
Karnataka must roll out a gradual phasing out program of subsidies having negative implications on environment like fuel subsidies for fishing, chemical fertilizers, and others.
It is imperative to provide greater access to electricity to the industrial sector, aiming at higher productivity and efficiency at reduced prices as high electricity tariffs impede industrial activity.
The state has identified that monetizing the underutilized and unutilized assets, land and buildings towards efficient use through public-private partnership is the way forward.
Women are doing exceedingly well education. Almost all girls are in school. Women dominate higher education. Their enrolment ratio is higher than that of men.
Karnataka has set a strategic target to grow its economy to USD 500 billion, when India aims for USD 5 trillion in FY 2026. Also, to grow to USD 1 trillion, in nominal terms, when India aims for USD 10 trillion in FY2032. Karnataka has to consistently accelerate growth higher than India to hit its target.
Karnataka also has a significant advantage with its comprehensive technology ecosystem and advanced capabilities in data analytics. It can apply these capabilities to build technology-first growth engines. Karnataka can be a leader to demonstrate to other states how a high-growth strategy can be formulated based on data analysis and technology.
Karnataka envisions to annually move 2% of its agriculture workforce into industry and services over the years to decrease agriculture workforce to 25%. Higher education and specialization for absorbing the surplus manpower into knowledge economy over the next decade and beyond.
Karnataka needs to create a social security net to protect all vulnerable sections and ensure everyone has food on the table, a roof over their head, water in the tap, internet and unimpeded access to digital platforms, power in their switch, toilet in the house, education for their children, gas in the stove and other basic necessities. Karnataka must set up a mission group to ensure these facilities are disseminated to all its citizens by 2025, thereby effectively eliminating poverty. As per NITI Aayog’s 2021 report on the Multidimensional Poverty Index, 13.2% of Karnataka’s population is multidimensionally poor. The state must aim to reduce this below 1% by 2030. (Kerala has already reached this goal)
Muslim community has the lowest enrolment in colleges compared to the population, because of greater poverty in the community. A large-scale program for enrolling Muslim youth in college supported by scholarships is required so they can also satisfy their dream of a college education.
Conclusions:
Kerala model is based on greater state intervention in the economy whereas Karnataka model is based on envisioning a promising future for its residents through empowering them with necessary education, skill sets and ease of doing business. Karnataka sees itself as an enabler of development through its forward-looking policies unlike Kerala which seeks to be the lead player in the economy.
 Write Comment |
  E-Mail To a Friend |
 Facebook |
 Twitter |
 Print
Print 


